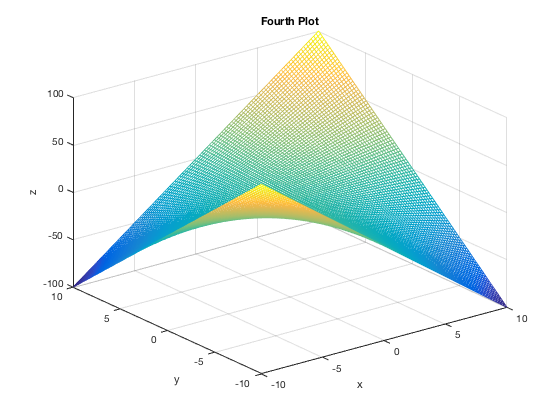
Example of Basic Script with figure command
Lisa Oberbroeckling, Spring 2012
close all
clc
% first plot
figure(1)
x=linspace(-pi,pi);
y=sin(x);
plot(x,y, 'r')
title('First Plot')
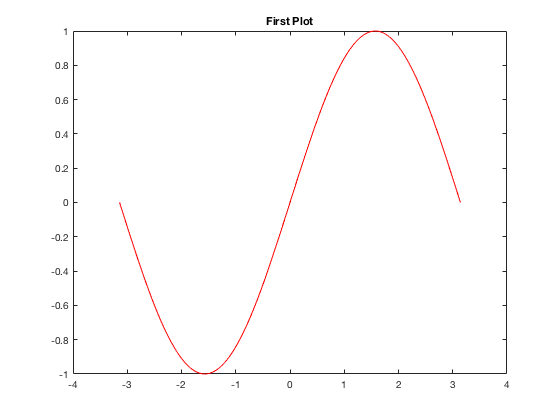
Second plot
figure(2)
[x,y]=meshgrid(linspace(-10,10));
z=sin(x).*cos(y);
mesh(x,y,z)
xlabel('x'),ylabel('y'),zlabel('z')
title('Second Plot')
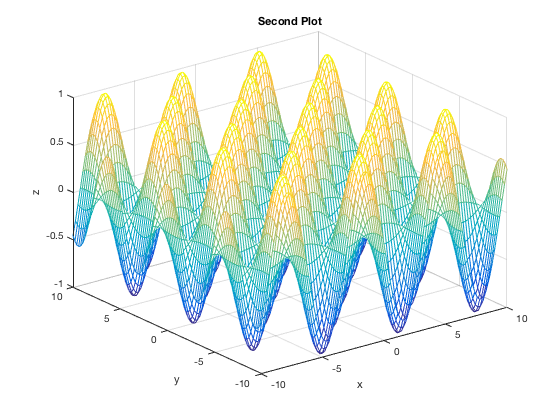
third plot
figure(3)
[x,y]=meshgrid(linspace(-10,10));
z=x.*cos(y);
mesh(x,y,z)
xlabel('x'),ylabel('y'),zlabel('z')
title('Third Plot')
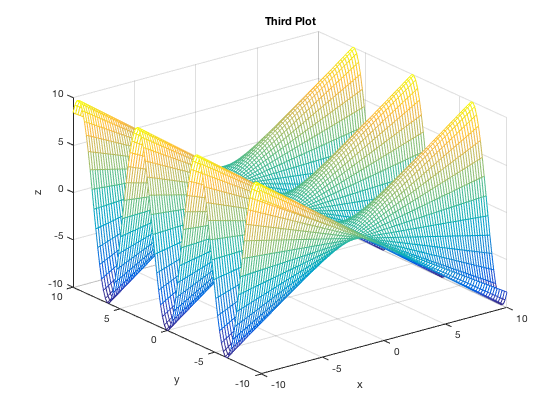
fourth plot
figure(4)
[x,y]=meshgrid(linspace(-10,10));
z=x.*y;
mesh(x,y,z)
xlabel('x'),ylabel('y'),zlabel('z')
title('Fourth Plot')