Introduction
Matlab can be accessed on any computer with internet by going to
Log in using your Loyola username and password. From there click "Academic Applications" and then "Matlab R2012a". A prompt will come up and click "Allow".
The first thing to do once Matlab is loaded is to change your Current Directory to your G: drive, which is simple to do. Just click the button with the ellipsis . . . on it and scroll to the G: drive. Therefore, everything will be saved to your G drive. So, now you can start experimenting!
Matlab is like a glorified calculator. You can add (+), subtract (-), multiply (.*), divide(./), and take powers (.^). For example, at the prompt type the following
(2+4).^3
and press return to see the answer. You can also assign variables in Matlab. Suppose you want to know how much 2 chairs and a table would cost if you knew that a chair is $5 and a table is $10. In Matlab, you would type the following
chair = 5; table = 10;
2.*chair + 1.*table
Note that if you type a semi-colon (;) the results will not appear.
For this lab we are interested in plotting functions. To do this you need a list of x values and a list of y values. So, how do you create a list? The easiest way is to just list the numbers. Suppose you wanted the numbers 1,2,3,4,5. Then in Matlab you would just type
x = [1 2 3 4 5]
Another option is to use the bracket notation [start:increment:end]. For example, if you want the values between 0 and 1, incremented by .25 for x, you would type
x = [0:.25:1]
Yet another option is to use the command linspace. For example,
x = linspace(-50,50,200);
will create 200 equally spaced points between -50 and 50, and will store the values in the variable x. Why did I add a semi-colon (;) on the end here?
Now, you can create y values that are based on these x-values. If you are using the commands * / ^, remember to put a . before the operations so that the command will be given component-wise. For example, if you wanted to square each element of x, you would use the command
y = x.^2;
Now that you have a list of x and y values you can plot the graph with the command
plot(x,y);
For different methods for plotting such as colors and marker style, type
help plot
and a list will be given showing the different options. For example, to have a plot of red circles, you would type
plot(x,y,'ro');
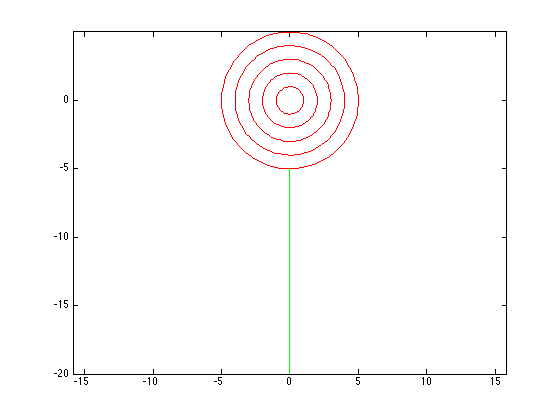
To add graphs to the figure use the command hold on, while the command hold off will release the graph. That is it! You should now have all the tools necessary to plot your first graph. An example of code to draw a lollipop is below. Experiment and make some pretty pictures!
x = linspace(0,2.*pi);
plot(cos(x),sin(x),'r')
hold on
plot(2.*cos(x),2.*sin(x),'r')
plot(3.*cos(x),3.*sin(x),'r')
plot(4.*cos(x),4.*sin(x),'r')
plot(5.*cos(x),5.*sin(x),'r')
plot([0 0], [-5, -20],'g')
axis equal