|
For this week's assignment, we are going to continue practicing with loops by looking at rigid transformations to create animated gifs. To begin note that a rigid transformation in 2D is made up of a rotation through an angle $\theta$ clockwise and translation (x,y)^T. A rotation through an angle $\theta$ can be represented as a 2x2 matrix:
\[R = \begin{pmatrix}\cos\theta & \sin\theta\\-\sin\theta & \cos\theta\end{pmatrix}\]
Therefore if you wanted to move a point (1,0) by 45 degrees and then move it to the right 2 units and down 1 unit, you would do the following in matlab:
>> R = [cosd(45) sind(45);-sind(45) cosd(45)];
>> R*[1;0] + [2;-1]
Notice the usage of cosd, sind instead of cos, sin. Can you figure out why? We will experiment with this idea in the following homework. This homework will also ask you to create an animated GIF. Here is some example code from Matlab
x = 0:0.01:1;
figure(1)
filename = 'testnew51.gif';
for n = 1:0.5:5
y = x.^n;
plot(x,y)
pause(.01)
drawnow
frame = getframe(1);
im = frame2im(frame);
[imind,cm] = rgb2ind(im,256);
if n == 1;
imwrite(imind,cm,filename,'gif','DelayTime',0, 'Loopcount',inf);
else
imwrite(imind,cm,filename,'gif','DelayTime',0, 'WriteMode','append');
end
end
Try to figure out what the code is doing. You will adapt this code to make animated GIFs for this week's homework.
Homework 3
- Create an m-file called hw3Last.m where Last is the first four letters of your last name in your MA302 folder. A startup m-file is located here.
- Create a script drawCircLast.m that creates the following animation:
 Steps to create this animation are as follow:
- Create nPts equally spaced points on the right hemisphere of a unit circle and store in a matrix called rit. Hint: Think about the unit circle.
- Adapt rit to create the left hemisphere.
- Iteratively go through and plot the line joining the point on the right hemisphere with the coordinated point on the left hemisphere. Be sure that the lines that are formed resemble a circle (help axis). Save the axis dimensions in a matrix.
- Iteratively go through and erase the lines (perhaps plot white lines?). Be sure you check your axes.
Create an animated-Gif for nPts = 25.
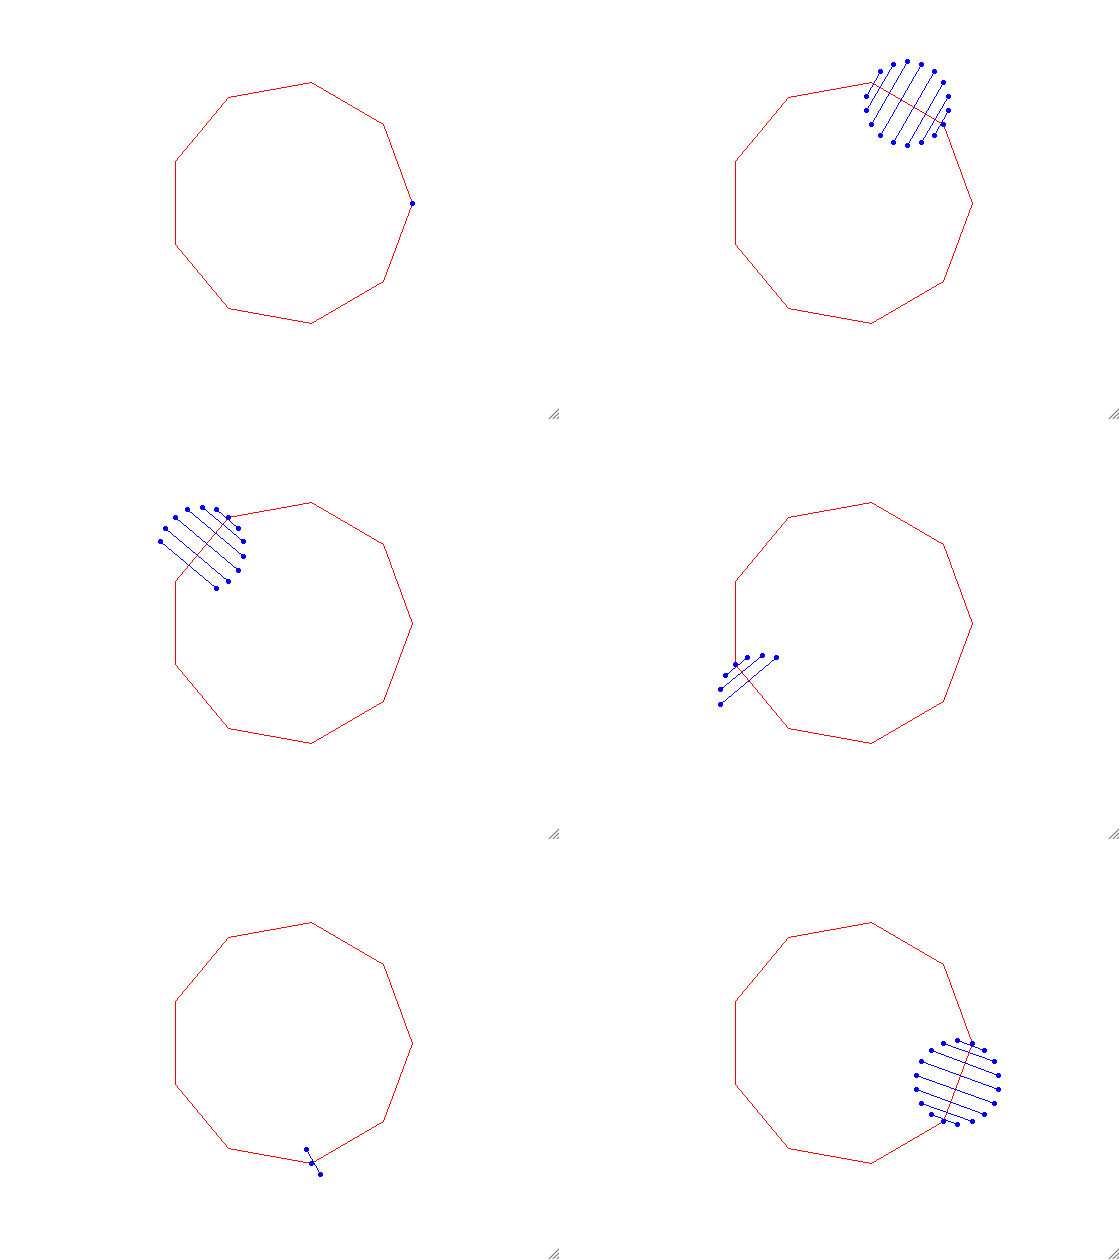
- Adapt drawCircLast.m to create a new script drawNewLast.m that creates the following animation.
 Note that the red polygon approximates a circle of radius 5 and has 9 sides. Each blue circle animation has 10 segments.
- Create your own animation! Make sure you have at least one loop and one rigid transformation. HAVE FUN! In order to motivate you here are some examples
- Post your m-file hw3Last.m to dropittome using the same password as we used in the first homework. In order to get full credit, your directories and files must be named correctly and you must have links to your function file and the m-file (script file) that created the webpage, along with the appropriate text, plots, and such to answer the problems.
|