|
For this week's assignment, we will continue playing with photographs. However, we will be learning something new when it comes to functions. Mathematically, a function is defined as a relation between a set of inputs and a set of permissible outputs with the property that each input is related to exactly one output. In programming, we can relax the number of inputs and outputs but the idea is the same. We take something as an input put it in a function and look at the output
Input -> FUNCTION -> Output
In Matlab we can create an m-file to do this for us. To begin, open a new file and have the top line be
function [OUTPUT] = functionName(INPUT)
Here is an example. Can you figure out what it does?
function [Area,Circum]=circleFun(radius)
% function [Area,Circum]=circleFun(radius)
% This function calculates the area
% and circumfrence of a circle
%
% Inputs: radius
% Output: Area, Circum
%
% Mili Shah
Area = pi*radius.^2;
Circum = 2*pi*radius;
Now in the Command Window, if you were to type
>> [A,C]=circleFun(3);
You will see that A = 28.2743 and C = 18.8496.
Now let's think of images. We can think of an image as an input, when we apply some operations on the image we can think this as a function, and the resulting image is the output. Let's look at an example:
function newImg = createFlip(img)
newImg = img;
[m,n,o]=size(img);
for row = 1:m
for col = 0:n-1
newImg(row,col+1,:) = img(row,n-col,:);
end
end
subplot(1,2,1); imshow(img)
subplot(1,2,2); imshow(newImg)
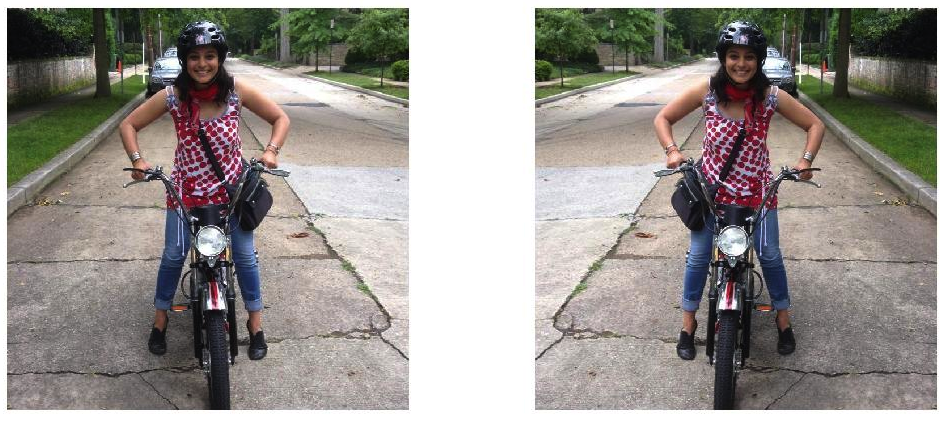
So you can see that there is an image of me and the reflected image. We will be playing with creating different functions in the Problem Set.
Problem Set 5
- Create an m-file called hw5Last.m where Last is the first four letters of your last name in your MA302 folder. You should now have the tools to create your own published files by adapting your previous homework. Note that I will be grading format starting this week. Your published file should be polished as if you were to turn it in as a final report.
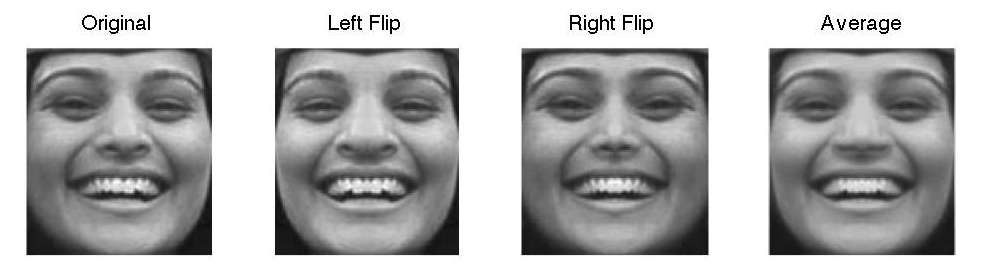
- Adapt createFlip.m to create your own function SymmetryLast.m that takes an image and creates
- the left symmetric image which flips the left half of an image to the right
- the right symmetric image which flips the right half of an image to the left
- the average symmetric image which averages the left and right halves of an image
The input should be img and the output should be lefImg, rigImg, avgImg. Apply this function to a picture of you and display the output in a 1x4 subplot along with the original image. The output should look like:
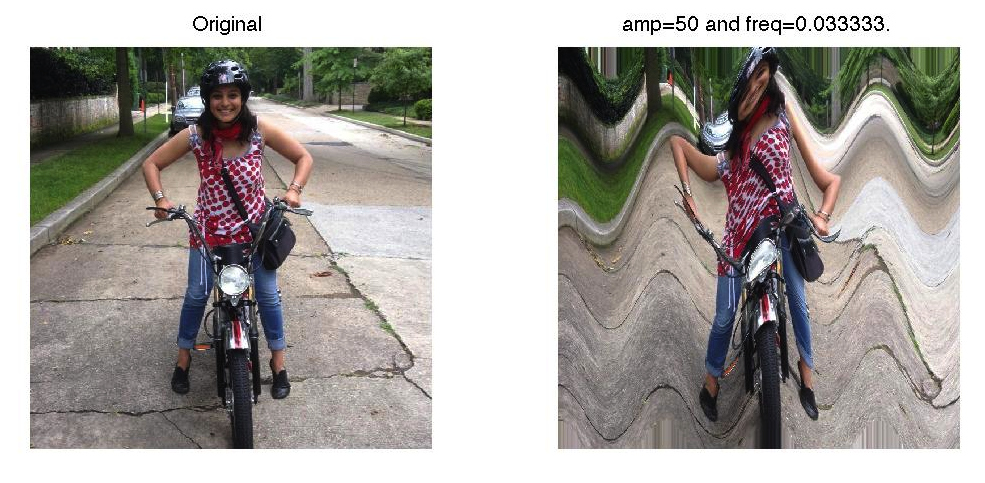
- Create a function waveLast.m that takes as inputs img, amp, freq and outputs the waveImg image that produces a wave in your picture. The wave can be created by allowing
x = x + amp*cos(freq*y);
y = y;
Here x, y are the pixel location in each of the RGB matrices, amp is the amplitude of the cos wave, and freq is the frequencey of the cos wave. Experiment with
amp = 50
freq = 1/30
Note with this problem that your x and y should be integers that are inside your domain of values. Think about how you can guarantee that this is true. The functions max and min may help you. Here are my results
- Create your own transformation function m-file and apply it to an image of your choice. Be sure to explain what your transformation does in your published file and how you got it.
- Post your m-file hw5Last.m to dropittome using the same password as we used in the first homework. In order to get full credit, your directories and files must be named correctly and you must have links to your function file and the m-file (script file) that created the webpage, along with the appropriate text, plots, and such to answer the problems.
|