Introduction
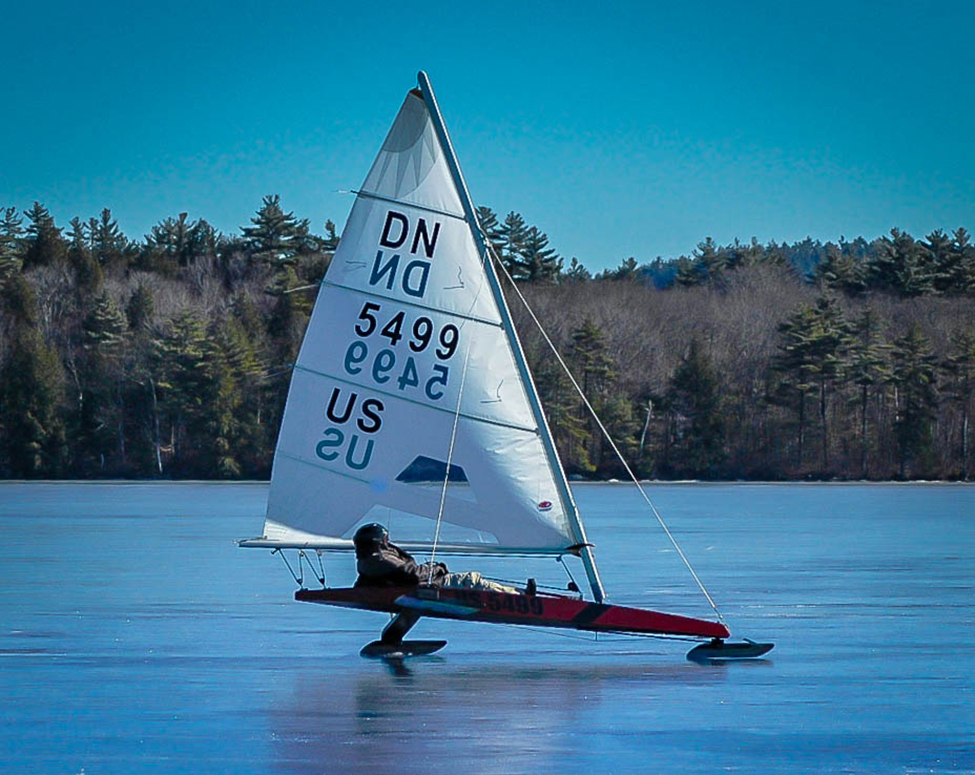
Iceboats are a common sight on the lakes of Wisconsin and Minnesota on winter weekends. Iceboats are similar to sailboats, but they are fitted with runners, or “skates,” and are designed to run over the ice, rather than on water. Iceboats can move very quickly, and many ice boating enthusiasts are drawn to the sport because of the speed. Top iceboat racers can attain speeds up to five times the wind speed. If we know how fast an iceboat is moving, we can use integration to determine how far it travels. We revisit this question later in the chapter (see Example 5.4.5).
Determining distance from velocity is just one of many applications of integration. In fact, integrals are used in a wide variety of mechanical and physical applications. In this chapter, we first introduce the theory behind integration and use integrals to calculate areas. From there, we develop the Fundamental Theorem of Calculus, which relates differentiation and integration. We then study some basic integration techniques and briefly examine some applications.
5.0.1 The Area Problem and Integral Calculus
We now turn our attention to a classic question from calculus. Many quantities in physics—for example, quantities of work—may be interpreted as the area under a curve. This leads us to ask the question: How can we find the area between the graph of a function and the -axis over an interval (Figure 5.2)?
As in the answer to our previous questions on velocity, we first try to approximate the solution. We approximate the area by dividing up the interval into smaller intervals in the shape of rectangles. The approximation of the area comes from adding up the areas of these rectangles (Figure 5.3).
As the widths of the rectangles become smaller (approach zero), the sums of the areas of the rectangles approach the area between the graph of and the -axis over the interval . Once again, we find ourselves taking a limit. Limits of this type serve as a basis for the definition of the definite integral. Integral calculus is the study of integrals and their applications.
Example 5.0.1 (Estimation Using Rectangles).
Estimate the area between the -axis and the graph of over the interval by using the three rectangles shown in Figure 5.4.
Solution: The areas of the three rectangles are 1 unit2, 2 unit2, and 5 unit2. Using these rectangles, our area estimate is 8 unit2.
Checkpoint 5.0.1.
Estimate the area between the -axis and the graph of over the interval by using the three rectangles shown here:
Hint: Use Example 5.0.1 as a guide.